Insights and Knowledge Extracted
One of the clearest takeaways from consumer behavior data is that attention is not the same as intention. Younger consumers spend a lot of time browsing, saving, and comparing products without immediately buying. High engagement and high traffic often look successful on the surface, but they do not guarantee high conversion.
Across the data on this page, the pattern is consistent. Phones and social platforms drive discovery, especially for Gen Z, but purchasing depends on trust. When that's missing, cost per lead increases and sales lag behind interest.
Example 1: Phones and Influencers Shape Discovery
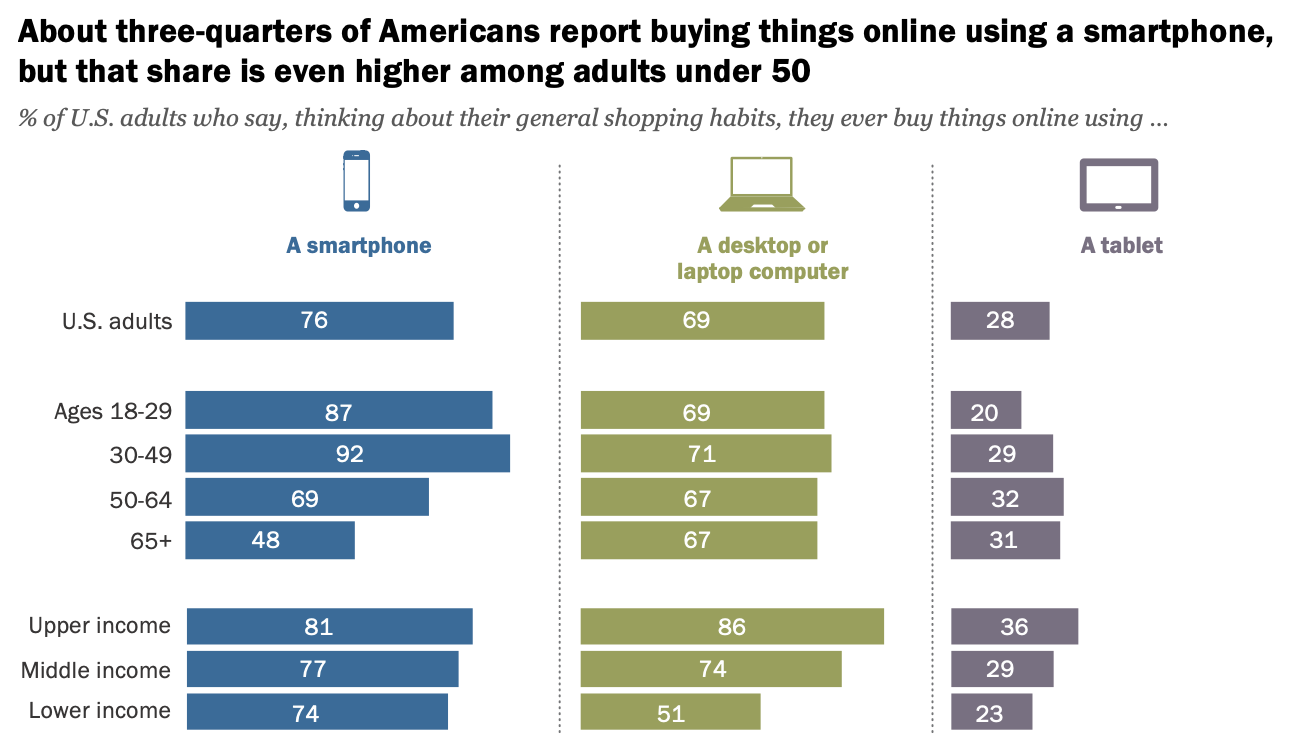
Source: Pew Research Center, For shopping, phones are common and influencers have become a factor especially for young adults
Pew Research shows that smartphones are a primary way younger adults shop online and that influencers play a real role in shaping what people explore and buy. This helps explain why discovery often happens long before someone reaches a brand’s website.
Companies can use this information to see how consumer's interests are shaped by social platforms and recommendations rather than direct intent to purchase.
Example 2: Heatmaps and User Attention
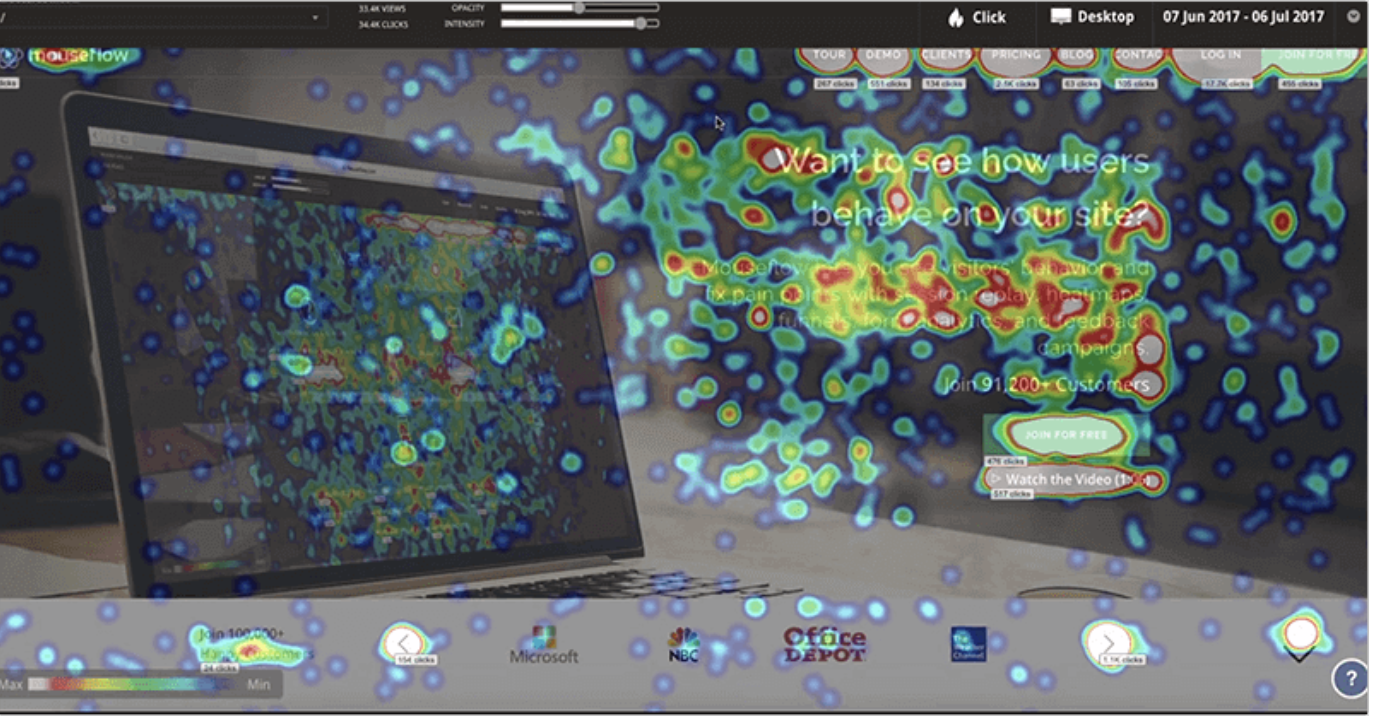
Source: QeRetail, The power of heatmaps in understanding customer behavior
Heatmaps translate user behavior into visual data. Instead of guessing why people hesitate or drop off, heatmaps show which elements attract attention and which are ignored.
Companies can use this type of data to understand why their site may feel confusing and why buyers may hesitate even when they are interested in a product.
Example 3: Traffic, Conversion, and Cost Per Lead
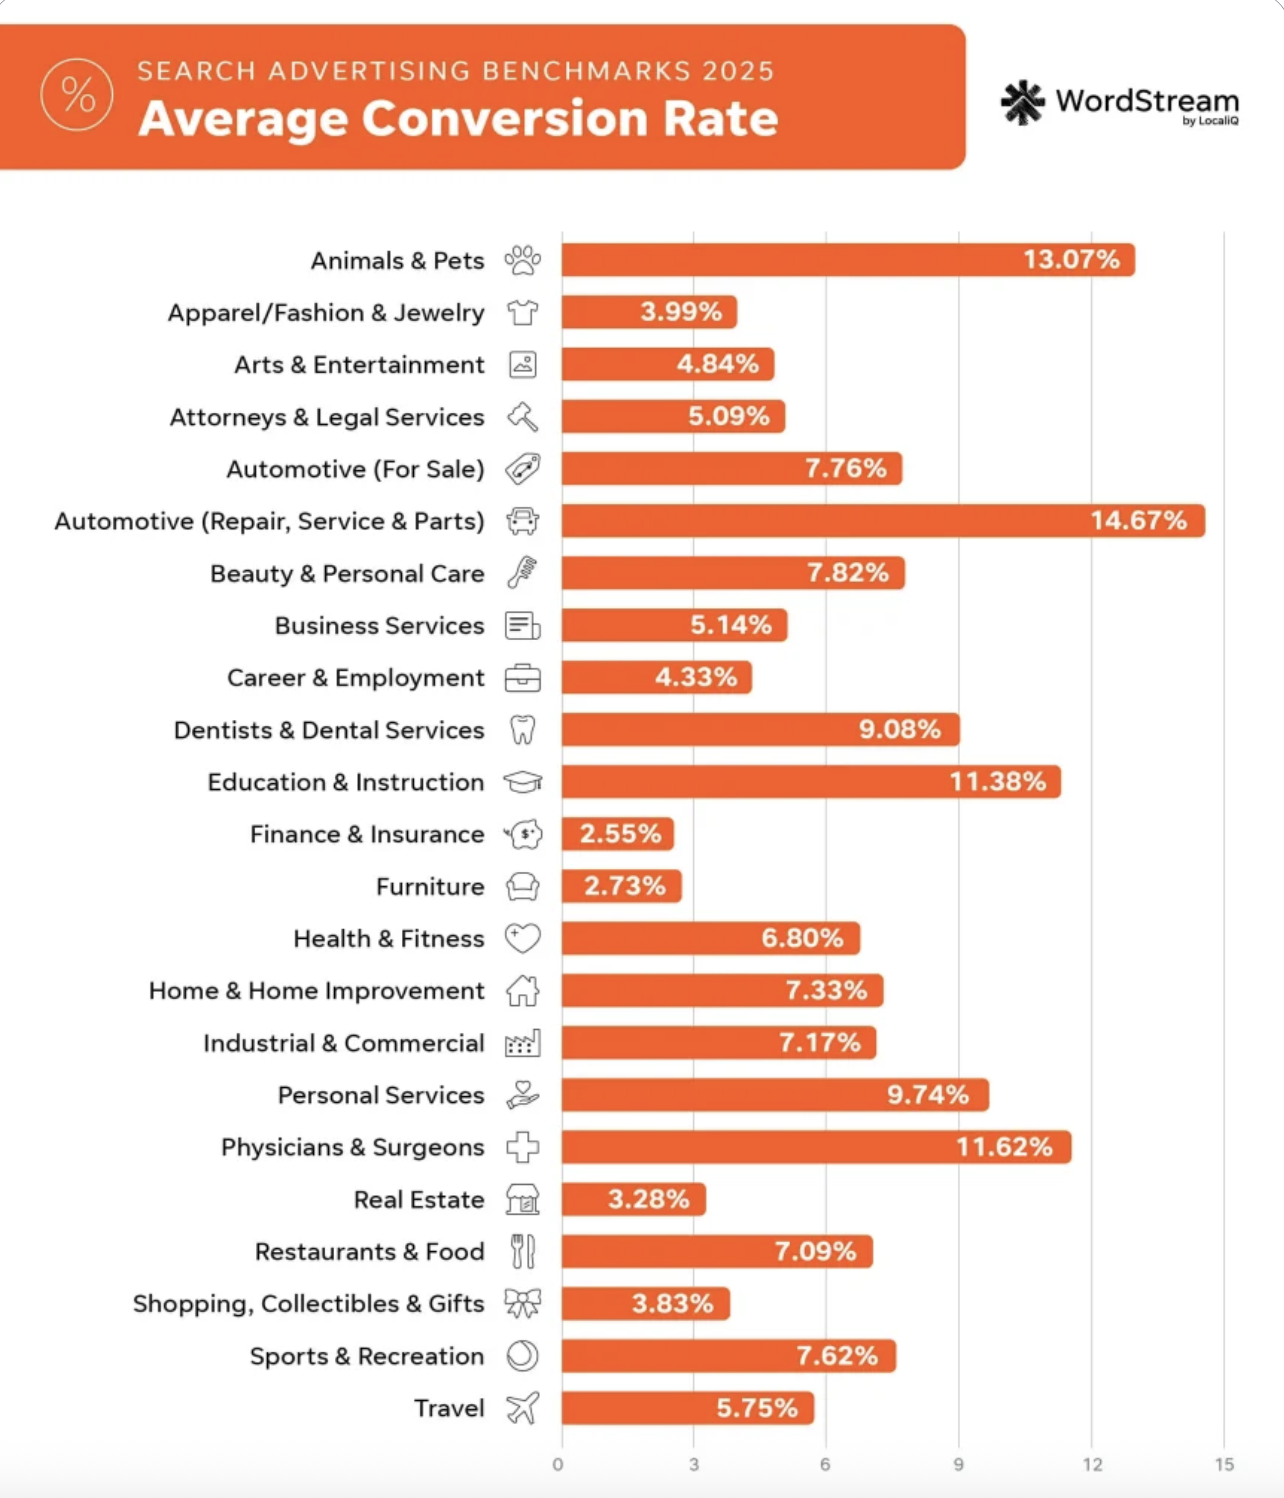
Source: WordStream, Conversion Rate Benchmarks for Your Industry
WordStream provides benchmarks that explain why increasing traffic does not always lead to more sales. Conversion rates and cost per lead give context to performance and show when attention is becoming expensive rather than effective.
This data helps companies understand that heavy advertising and visibility do not always mean better value or better experiences.
Web Resources
 Pew Research Center
Page: For shopping, phones are common and influencers have become a factor especially for young adults
 QeRetail
 WordStream
Sample Walkthrough
- Start with Pew Research to understand how phones and influencers shape discovery and early interest.
- Use the heatmap examples to see how attention is distributed and where users hesitate or drop off.
- Compare that behavior with conversion and cost benchmarks to understand why interest does not always become action.
- Combine these insights to recognize that modern shopping relies on trust more than exposure.